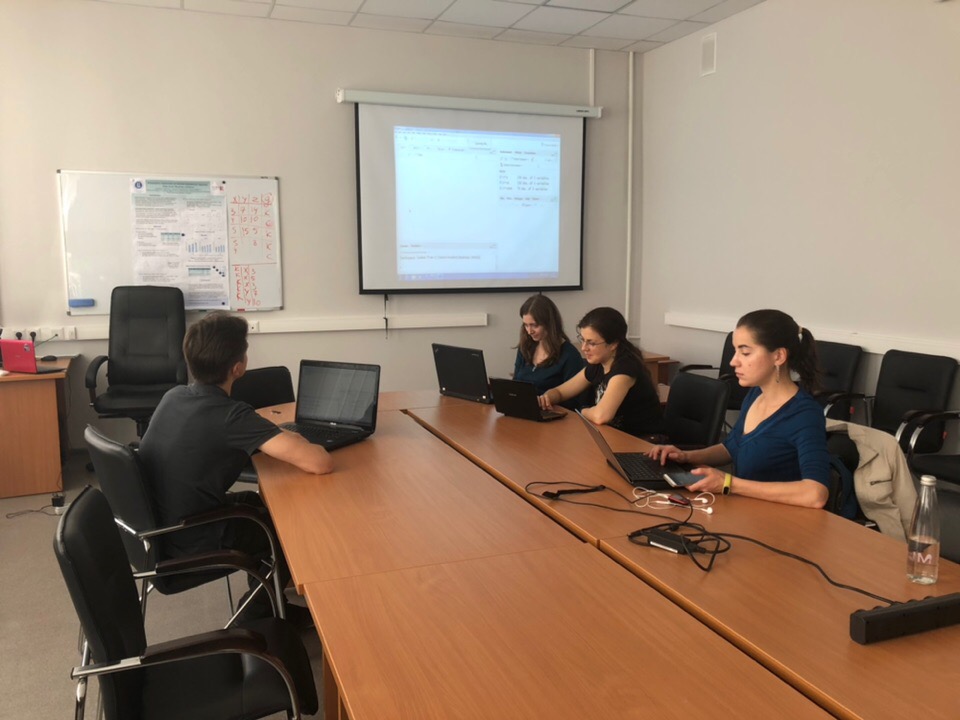
Introduction to R II of II

Data visualization is critical for properly communicating research findings. This second part of Introduction to R is built on knowledge from the previous tutorial and focussed on practical examples in preparing simple tables and basic graphs for data illustration. This is an introductory tutorial for those who have no or limited experience in R, who are planning to learn R by themselves.
During this seminar we covered the following topics:
- Creating tables
- Producing graphs
The materials from this seminar can be downloaded by the following link: R_tutorial_II.r
